
|
| |
|
Строительный блокнот Introduction to electronics Thus, the average tiatisistor wavetbrins obey a power sink iji) characteristic. Wlien = 0, tlieii the average power (pil))j. is a function only of i 4, anti/j. The presence of the artificial tatnp causes (p(O)rj to additionally depend j on the converter voltages, via The power sink characteristic can also be explained via inductor energy aiguinents. During the first subinterval, the inductor cunent increases fromO to l. In the process, the inductor stores the following energy: (12.109) v(() ТЪе energy W is transferred from the power input v. through the switch netw[)rk input port, to the inducttir, once per switching pericxl. This energy transfer process accounts tor the power flow (12,110) i,(t) The switch network input port, that is, the transistor ter-tninals, can therefore be tnodeled by a power sink ele-tneut, as in Fig. 12.32. The average switch network output port current, that is, the average diode current, is (12.111) By inspection of Fig. 12.31, the iirea is given by
The duty cycle d. is detennined by the time required for the inductor current to return to zen), during the second subintervai. By arguments similar to those used to derive 1 Waveforms, CPM DCM buck-boost Eq. (11.12), the duty cycle rfj can be found as follows: example. dp) = dft) (12,113) Substitution of Eqs. (12.113), (12.112), and (12.110) into Eq. (12.111) yields (12.114) The output port ofthe averaged switch network is therefore described by the relationship Fig. 12.31 CPM DCM bucit-bciost converter mode!, derived via averaged switch modeling. (12,115) In the avetaged mtidel, the diode can be replaced by a ptiwer source of vaine{p(0)7ii equal to the ptiwer apparently consumed at the switch network input port. During the second subinterval, the inductor releases all of its stored energy through the diode, to the converter output. This resuits in an average power flow ofvalue {p(t})j. A CPM DCM buck-boost averaged mode! is therefore as given in Fig. 12.32. In this model, the transistor is simply replaced by a power sink ofvalue {p(0)r< while the diode is replaced by a power source also ofvalue (р(1))т- The steady-state equivalent circuit model of the CPM DCM buck-boost converter is obtained by letting the inductor and capacitor tend to short- and tipen-circuits, respectively. The mtxiel of Fig. !2.33 is [obtained. The steady-state output voltage Fcan now be determined by equating the dc load power to the converter average power (p(f))j,. For a resistive load, one obtains (12.116) where the steady state value of (/)(f))j. is given by (12.117) and where is the steady-state value of the control input i/Г). Solution for Vyieids the following resu!t Fig. 1233 Steady-state model of die CPM DCM buck-boost converter 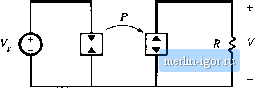 Fig. 12J4 Averaged models Q of egrrent-programmed TXM converters: (a) buck, (b) boost. ТПЛГ ТПЛГ {12,11S) for the case of a resistive load. Averaged mtxiels ofthe DCM CPM buck, boost, and other converters can be found in a similar manner. In each case, the average trimsistor wavefonns iue shown to follow a ptjwer sinlt chiiracterisdc, while the average ditxle wavefortns follow a power source chiiracteristic. The resulting equivalent circuits of the CPM DCM buclt and boost converters iire illustrated in Fig. 12.34. In each case, the average power is giveti by Table 12.6 Steady-state DCM eurrelt-pюgгammed characteristics of basic converters Converter Stability range when m = 0 Buck Boost I m-1 T 0<D< 1 Buck-4xx>st Depends on load characteristic: 2(M-11 0£d< 1 |