 | |
|
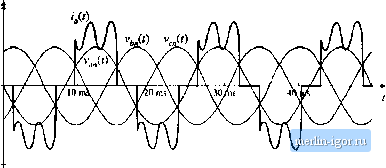
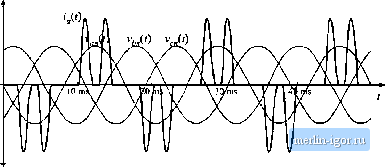
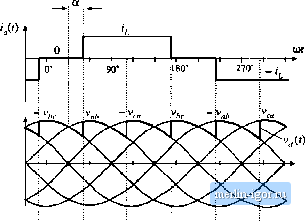
Строительный блокнот Introduction to electronics tig. 17,8 Ac curreiu waveform tot the case when inductor L is Jargo. The phase is drawn with respect to tlie zero crossing of the line-to-neutral voltage vJt). tao- 360* ficiendy large, as well as when the filter elements L and Care removed entirely. In the limit, when L is very large, then the current is essentially constant. The current in phase a, iJt), is then as shown in Fig. 17.S. It can be shown that the Fourier series for this waveform is л= l.i.T.li )sin(nce() (17.6) which is similar to the spectrum of the square wave of the single-phase case, but with the triplen harmonics missing. The THD of this waveform is 31%, and the distortion factor is ,1/7t = 95,5%. As in the case of the square wave, the amplitude of the odd nontriplen ft harmonic is (l/ ) tunes the fundamental amplitude. So this waveform contains 20% fifth harmonic, 14% .seventh harmonic, 9% eleventh harmonic, etc. It is interesting that, in comparison with the square-wave single-phase са.че, the missing 60° in the three-phase case improves the THD and power factor, by removing the triplen harmonics. With a less-than-infinite value of inductance, the output ripple causes the ac line currents to be rounded, as in the typical waveform of Fig. 17.9. This wavefonn has a 31.9% THD, with a distortion factor that is ntit much different .from the waveform of Fig. 17.8. THD = 31.9%  Fig. 17.9 Cctntinuiius conducliun mode ac line-neutral voltages and phase a eun-ent. for a moderate value of inductance. 17.2.2 Dl.scontinu( us C( nducti( n M( de If the inductance is further reduced, then the three-phase rectifier enters the discontinuous conduction mode. The rectifier then begins to peak-detect, and the current waveforms become narrow pulses of high amplitude, occurring near the peaks of the line-line voltages. The phase a line current i,(f) contains two positive and two negative pulses, at the positive and negative peaks of the line-line voltages vjfj) and Vj;). As in the single-phase case, the total harmonic distortion becomes quite large in this са.че, and the 17.3 Phase Control 617 THD =99.3%  Fig. 17.10 Discontinuous conduction mode ac Jitie-neutral voltages and phase a curretit. power factor can be significantly degraded. A typical waveform is given in Fig. 17.10. Tills waveform has a THD of 99.3%, and a distortion factor of 71%. This would be considered unacceptable in high-power applications, except perhaps at light load. 17.3 PHASE CONTROL There are a wide variety of schemes for ctmtroihng the dc output of a 3o rectifier using thyristors [1,2]. The most common one is shown in Fig. 17.11, in which the six diodes of Fig. 17.7 ;ire replaced by silicon controlled rectifiers (SCRs). Typical waveforms are given in Fig. 17.12, for large dc-side fiiter inductance. If Qi were an uncontrolled diode, it would conduct whenever the iine-to-line voltage vj or v, is the largest in magnitude of the six line-line v[)ltages v, v., v, f and v.,. This [)ccurs for 120° of each cycle, beginning at the point where vj, = v.j Ln Fig. 17.12, this occurs at (Of = 60°. The output voltage ofthe controlled rectifier is controlled by delaying the firing of by an angle a, such that Qi begins conducting at (Of = 60° -I- (X. This has the effect of reducing the dc output voltage. There can be no dc component of voltage iicross inductor L Hence, in steady-state, the dc component of the rectifier output voltage Vj,(f) must equal the dc iuad vuitage V. But Vjt) is periodic, with period equal to six times the ac line period (or 60°). So the dc component of (г) can be found by Fourier analysis, and is equal to the average value of Vj((0. Over one 60° interval, for example (60° + a) < Wf < (120 + a), Уд() follows the line-line voltage vj(f) = W, sin (Oil + 30 ).The average is therefore kci Jfc?: ЖОз лплг\  dc load Fig, 17.11 Basic controlled 3f) bridge rectifier circuit, with dc-sldc L-C filter. = v sin m Fig. 17.12 Waveforms for the controlled rectifier of Fig, 17.11, wilh large dc lilter inductance. 
(17,7) where V, i.s the rras iine-to-line voltage. This equation is plotted in Fig. 17,13. It can be seen that, if it is necessary to reduce the dc output voitage to values close to zero, then the delay angle a raust be Fig. 17.13 Variation of the dc output voltage V with delay angle rt, for the phase-controlled circtiit of Fig, 17.11, 0.5 - 0 -- -0.5 - -1 - -1.5
150 180 a, degrees |